

The macro-environment is affecting Working Capital efficiency today and simultaneously why Working Capital Management is crucial to your business success.
In 2023, we are currently facing a period of economic change unlike many of us have experienced for many years – rising interest rates, rising cost-push inflation, increased capital costs, rising operating costs, supply chain and labour constraints, increasing costs of living, a looming recession, and a lingering COVID-19 pandemic.
What the uncertainly caused by current events has highlighted for Australian businesses, it is the critical importance of cash management, liquidity, and cashflow. So, in response to how costly debt has become and with forecasting of future increases, organisations are reassessing their capital expenditures. CFO’s and Finance Leaders Treasurers want to understand how budget profiles may have changed or those mostly likely to change, and which investments should be postponed or cancelled.
Businesses that have emerged from the COVID-19 pandemic are leaner, meaner, and smarter. Out of necessity, they have embraced disrupted change to their core business model, reduced operating costs, embraced hybrid work (WFH), raised prices, restructured their real estate leases and debt obligations, and implemented other cost reductions initiatives — an example of just some of the strategies that has allowed them to conserve precious cash for future use.
But many organisations may still have “untapped liquidity” and then liquidity generation opportunities that will be needed in a downturn economy, but WHERE do you look to find this alternative cash resource?
What’s the secret to tapping into your organisation’s potential liquidity?
Many organisations have not been focusing on Working Capital initiatives. This is historically due to the low value of their Weighted Average Cost of Capital and with more sustained focus on driving sales revenue and profitability. In 2023 and upcoming periods, with increasing interest rates and debt becomes more expensive, more and more businesses will have to prioritise their Working Capital strategies and what internal efficiencies can be streamlined to use as a source of cash.
Well, the simple answer can be found in a less well understood but certainly underappreciated financial metric — the Cash Conversion Cycle (CCC).
For organisations that need to manage physical inventory, such as those involved in manufacturing distribution, construction, or retail, inventory control and management are critical components of the Cash Conversion Cycle (CCC). One of the main aims of Working Capital is to run a business with minimal cash as possible being tied up in Inventory or Accounts Receivable. The CCC follows this process from purchasing Inventory to settling both Accounts Receivable and Accounts Payable – but this doesn’t apply to businesses that deal with intangible goods, as they don’t need to manage physical Inventory.
The intrinsic value of the Cash Conversion Cycle (CCC)
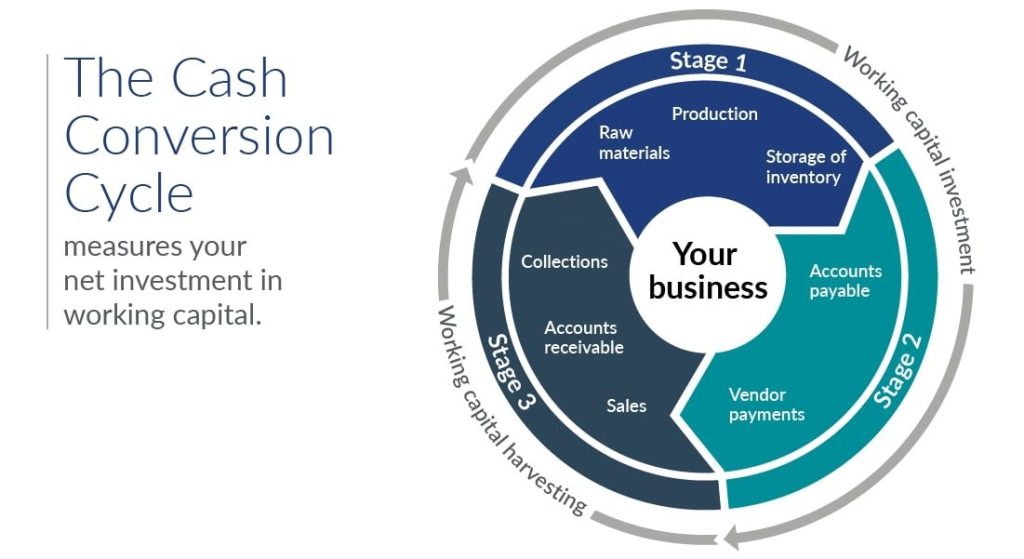
The Cash Conversion Cycle (CCC) is but one of several quantitative measures that helps evaluate the efficiency of a company’s operations and management. An important Working Capital metric and leading indicator of operational efficiency, liquidity risk, and overall financial health. It measures how efficiently your organisation is managing its Working Capital and by measuring how many days it takes for the business to convert cash into inventory, and then back into cash, via the sales process.
The liquidity of any organisation can be trapped in each of the three (3) key components of Working Capital, including processes – Accounts Receivable, Accounts Payable, and Inventory. Effectively, the cash is trapped and cannot be used for other purposes (time), as it is moving through the entire supply chain process. The shorter the value of an organisation’s Cash Conversion Cycle (CCC), the less time that cash is trapped in its operations within Accounts Receivable and Inventory.
But how can you avoid this situation? Well, to accelerate cashflow, then simply improve performance in any singular one (1) of the below three (3) financial metrics – decrease DSO, decrease DIO, and increase DPO – and all items contribute to lowering the value of the Cash Conversion Cycle (CCC).
How to calculate the Cash Conversion Cycle (CCC)?
Cash Conversion Cycle (CCC)
Formula
Cash Conversion Cycle (CCC) = Days Inventory Outstanding (DIO) + Days Sales Outstanding (DSO) – Days Payable Outstanding (DPO).
Criteria and Explanation
Days Inventory Outstanding (DIO) and Days Sales Outstanding (DSO) are associated with business cash inflows, while Days Payable Outstanding (DPO) represents cash outflow. This is why Days Payable Outstanding (DPO) is the only negative figure in the formula calculation.
So, here is another way to view the formula calculation. Days Inventory Outstanding (DIO) and Days Sales Outstanding (DSO) are both linked to Inventory and Accounts Receivable, which are both considered short-term Assets and thus taken as positive indicators. Days Payable Outstanding (DPO) is linked to Accounts Payable, which is considered as Liabilities, and thus taken as a negative indicator.
Key Components
- CCC is a key indicator of Working Capital Management efficiency.
- CCC is a mathematical formula that involves calculating the net aggregate time involved across the above three (3) stages.
- CCC uses DSO, DPO and DIO to demonstrate how effective the business is at managing its short-term assets and liabilities.
DIO (Days Inventory Outstanding)
Formula
DIO = (Av. Inventory Balance for Period / Cost of Goods Sold [COGS]) x Number of Days in the Accounting Period.
Key Components
- DIO shows how quickly inventory is sold.
- Selling stock faster has a positive and key impact on Working Capital, as it means that less cash is trapped in unsold goods or inventory management.
- Reducing DIO indicates the more efficiently the business is converting Working Capital into Inventory, and then back again.
- A smaller DIO figure is the best result here.
DSO (Days Sales Outstanding)
Formula
DSO = (Av. Accounts Receivable amount for Period / Total Credit Sales in the same Period) x Number of Days in the Accounting Period.
Key Components
- DSO shows how long it takes to collect cash from customers.
- Faster sales collections have a positive Working Capital impact.
- Reducing DSO will accelerate cashflow into the business.
- A smaller DSO figure is the best result here.
DPO (Days Payables Outstanding)
Formula
DPO = (Av. Accounts Payable / Cost of Goods Sold [COGS]) x Number of Days in the Accounting Period.
Key Components
- DPO shows how long it takes to pay suppliers.
- Longer payment durations have a positive impact on Working Capital.
- Increasing DPO indicates the business operational ability to hold onto cash for longer periods (time), after the sale of inventory.
- A larger DPO figure is the best result here.
How to interpret the Cash Conversion Cycle results?

There are many financial ratios that organisations use to calculate and enable a real-time view of their business performance. The Cash Conversion Cycle (CCC) is not one of them.
However, the best purpose of the Cash Conversion Cycle (CCC) is to provide a holistic view of business performance by tracking results over an extended period (time) and using this information to benchmark against your market competition.
The Cash Conversion Cycle (CCC) is a useful management tool but best utilised by select industry sectors, such as manufacturing, distribution, construction, or retail organisations that are dependent on inventory management and related operations. The CCC is not particularly relevant for service and consulting businesses, which will find financial ratios such as the Debt-to-Equity Ratio or the Return on Equity Ratio more suited to their analysis requirements.
A working example of the Cash Conversion Cycle (CCC)
Calculating your Cash Conversion Cycle (CCC) may look intimidating at first glance. But it’s a simple process that requires a basic understanding of the metric elements involved with the CCC calculation. The information from the above-mentioned figures are standard items and referenced on the following Financial Statements:
- Balance Sheet
- Income Statement (or Profit & Loss Statement)
Once accurate values are determined from the DIO, DSO, and DPO calculations, simply convert them into the Cash Conversion Cycle (CCC) formula. Below is a hypothetical example on how to calculate the CCC and then compare results vs. Competitor “A”. This simple CCC comparison is to determine whose cycle is better (same industry sector) and who is currently more efficient in its operational areas.
| Financial Metrics | Your Business | Competitor “A” |
|---|---|---|
| DIO | 14.6 | 12.4 |
| DSO | 55.9 | 46.2 |
| DPO | 17.3 | 23.7 |
| CCC (Break-up) | 14.6 + 55.9 – 17.3 | 12.4 + 46.2 – 23.7 |
| CCC | 53.2 Days | 34.9 Days |
Analysis of Results – Your Business vs. Competitor “A”
Well, the overall analysis and variance in results makes for interesting viewing! Therefore, it takes Competitor “A” approximately 34.9 Days to turn its initial cash investment with inventory back into cash and when compared to your CCC result of approximately 53.2 Days.
With the CCC variance of (-18.3 Days), if the normal course of business continues and all other elements remain constant, Competitor “A” will still be better at managing their Working Capital and more efficient in delivering its business objectives.
Next Steps?
Determine your elements of change, identify cash opportunities, then prepare (and execute) your Action Plan to unlock “free” cash from operational areas and secure internal funding to help grow your business.
Gain more insights into the Cash Conversion Cycle (CCC) results!
As with other cashflow calculations, the leading indicators are as follows:
Positive (Short or Long) vs. Negative Results
- A positive Cash Conversion Cycle (CCC) represents the X number of days when a business can turn cash into inventory, and back again.
- The shorter the Cash Conversion Cycle (CCC), then an organisation has good internal management. It is better at selling its inventories and recovering cash from their customer sales, whilst also paying their vendors.
- The longer the Cash Conversion Cycle (CCC), then an organisation has specific internal management issues and suggests inefficiencies in using its short-term Assets. A high and poor CCC may indicate a long period (time) to collect payment arrears from its customers or may be ineffective at forecasting demand for its products (time to convert Inventory into Sales) or may have inconsistent supplier terms for releasing payments to its vendors.
- A negative Cash Conversion Cycle (CCC) represents the X number of days when a business receives payment for the inventory it sells, but before paying its suppliers. Alternatively, your vendors are financing your business operations.
Analysis and Results Comparison – Internal vs. External (Benchmarking)
- The analysis and results derived from the Cash Conversion Cycle (CCC) should always be compared to other organisations but operating within the same industry sector and conducted on a trend analysis (quarter, year-on-year).
- The typical length of the Cash Conversion Cycle (CCC) will vary considerably between different industry sectors based on the nature of business operations meaning that there is no single figure that represents a good or bad CCC.
- In addition, comparing the cycle (and previous periods) of your business to its market competitors helps to determine whether your organisation’s Cash Conversion Cycle (CCC) is “normal” compared to its industry competitors and gauge whether its Working Capital Management is deteriorating or improving.
Additional Funding or Investments
- Investors, lenders, and other financing sources often assess an organisation’s Cash Conversion Cycle (CCC) and other financial metrics to determine both its financial health and its liquidity, before deciding whether to approve additional loans or consider long-term investments.
- The more liquid an organisation is, the more easily it can pay back loans, meet its other financial obligations and invest in business growth.
Summary
In a competitive business environment, CFO’s and Finance Leaders are responsible for optimising Working Capital Management in their organisation. By actively monitoring changes in your Cash Conversion Cycle (CCC), comparing to past business performance, and benchmarking to industry competitors, this allows for the analysis and identification of trends and helps anticipate strategic pivots along your future path.
Optimising your Cash Conversion Cycle (CCC) is a powerful metric, but good information is only useful if you do something with it! There are practical, operational, and commercial limitations on how low Working Capital levels can fall without adversely affecting operational performance and both customer and vendor relationships. But it enables you and your business to be nimble, analyse where cash improvement opportunities exist, and then undertake the change transformations required towards a more profitable and sustainable future.
This article was a Guest Author contribution and collaboration with CreditorWatch.
Need some guidance on your next steps? Let’s start a conversation…